8.10 火山图 EMP_volcanol_plot
模块EMP_volcanol_plot可以通过绘制火山图对差异性分析结果进行可视化。
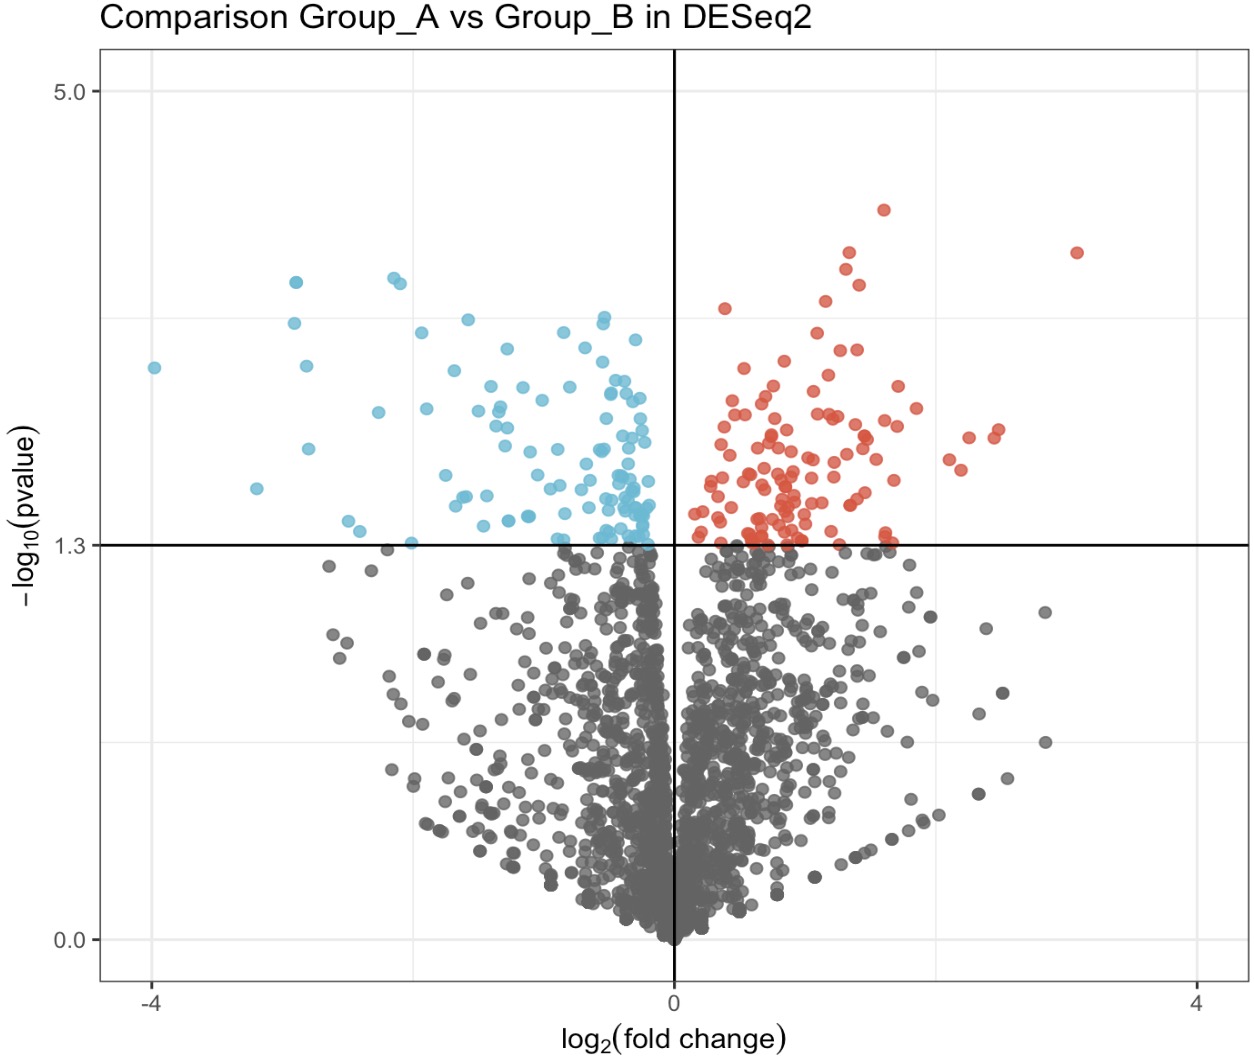
8.10.1 无特征标注的火山图
注意:
参数
参数
show可以提供html交互式图形展示。🏷️示例:
MAE |>
  EMP_decostand(experiment = 'geno_ec',method = 'integer') |>
  EMP_diff_analysis(method='DESeq2',.formula = ~Group)  |>
  EMP_volcanol_plot(show='html')
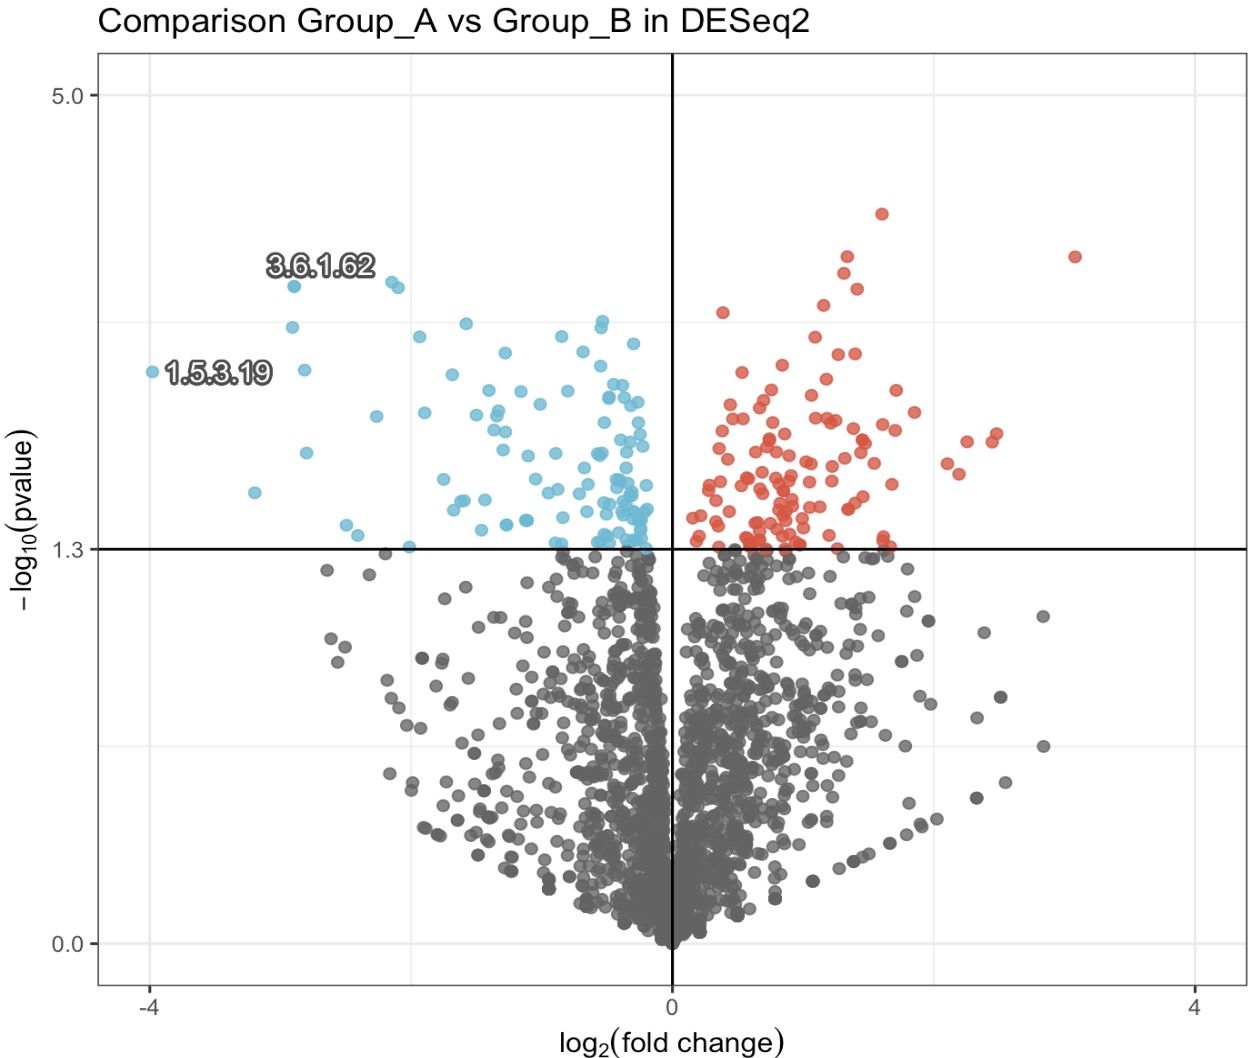
8.10.2 标注特征的火山图
注意:
本模块继承了ggrepel::geom_text_repel的参数用法,可以标注感兴趣的特征。
本模块继承了ggrepel::geom_text_repel的参数用法,可以标注感兴趣的特征。
🏷️示例1:
MAE |>
  EMP_decostand(experiment = 'geno_ec',method = 'integer') |>
  EMP_diff_analysis(method='DESeq2',.formula = ~Group)  |>
  EMP_volcanol_plot(key_feature = c('3.6.1.62','1.5.3.19'),show='pic',
                    min.segment.length = 0, seed = 42, box.padding = 0.5)
🏷️示例2:
MAE |>
  EMP_decostand(experiment = 'geno_ec',method = 'integer') |>
  EMP_diff_analysis(method='DESeq2',.formula = ~Group)  |>
  EMP_volcanol_plot(key_feature = c('3.6.1.62','1.5.3.19'),color = "white",
                    bg.color = "grey30",bg.r = 0.15)